Asked by Rachel Dusett on May 10, 2024

Verified
Refer to the diagram below to answer this question. 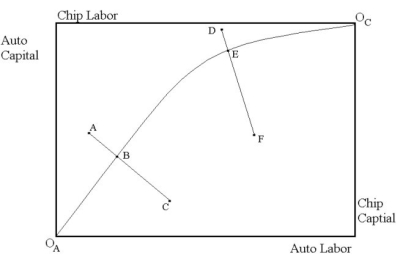 The Edgeworth Box diagram above refers to input usage in the automobile industry and the computer chip industry. The contract curve is given by
 . All points on this curve correspond to input prices being equivalent across industries. For example, the line segment AC indicates the input price ratio at point B in the two industries. Also, line segment DF indicates the input price ratio at point E in the two industries. The diagram below presents the production possibilities frontier for automobiles and computer chips.
 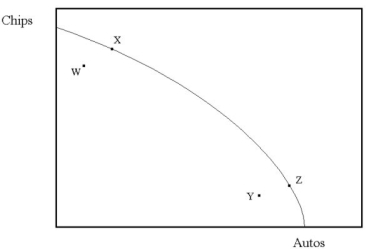 The labeled points in the production possibilities frontier diagram correspond to the points A, B, E, and F in the Edgeworth Box diagram above. Which points in the production possibilities frontier diagram correspond to which points in the Edgeworth Box diagram? Why?
Input Price Ratio
The ratio of the prices of the inputs used in the production of goods or services.
Edgeworth Box Diagram
A graphical representation used in economics to show various distributions of resources and to demonstrate the efficiency of markets.
Production Possibilities Frontier
A curve depicting all maximum output possibilities for two or more goods given a set of inputs, assuming all resources are fully and efficiently utilized.
- Describe and analyze the production possibilities frontier, including its significance for economic decisions and compromises.
- Implement the principle of economic productivity, encompassing both input and output efficiency, across various market scenarios.

Verified Answer
JF
Jason FolbiggMay 14, 2024
Final Answer :
Point A must correspond to point W. We know that point A is not an efficient production level because the input prices are not equal across industries. Further, we know that point A provides smaller output of automobiles than point B. In fact, point A must provide the smallest automobile production than all points labeled in the PPF. This is because the automobile industry is using the least amount of inputs at this point. Point B must correspond to point X. We know that point B is efficient and must lie on the production possibilities frontier because input prices are equal across industries. We also know that automobile production at point B must be below automobile production at point E. This implies that point B corresponds to point X. Point E must correspond to point Y. We know that point E is efficient, as input prices are equal across the two industries. Also, point E provides for greater automobile production than point B. Thus, point E corresponds to point Y. This means point F corresponds to point Z.

Learning Objectives
- Describe and analyze the production possibilities frontier, including its significance for economic decisions and compromises.
- Implement the principle of economic productivity, encompassing both input and output efficiency, across various market scenarios.