Asked by Lacey Johnson on Apr 24, 2024
Malaria is a leading cause of infectious disease and death worldwide.It is also a popular example of a vector-borne disease that could be greatly affected by the influence of climate change.A study was done to determine the relationship between reported malaria cases in West Africa and several weather variables (for example,mean temperature (°C) ,dew point (°C) ,maximum temperature (°C) ,minimum temperature (°C) ,and total precipitation (mm) ) .The data were collected over a 10-year period.Below are the results of a correlation analysis with all considered variables.The Pearson correlation coefficients are displayed as the top value.The P-value for the test of the null hypothesis that the population correlation is zero versus the two-sided alternative is the bottom value. 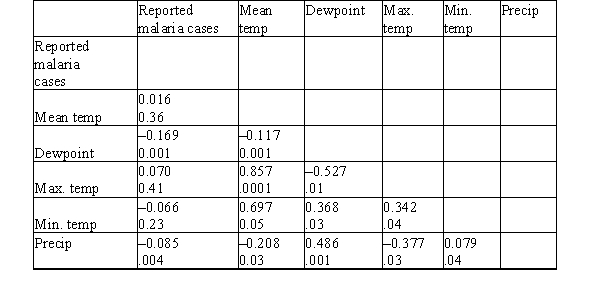 Is the correlation between reported malaria cases and maximum temperature statistically significant?
A) No,the P-value is .41.
B) Yes,the P-value is .41.
Vector-borne Disease
Illnesses caused by pathogens and parasites in human populations, transmitted by vectors such as mosquitoes, ticks, and fleas.
Pearson Correlation
A measure of the linear correlation between two variables, denoted by the correlation coefficient, ranging from -1 to 1, where 1 indicates a perfect positive linear relationship, -1 a perfect negative linear relationship, and 0 no linear relationship.
P-value
The probability of obtaining test results at least as extreme as the results observed, assuming that the null hypothesis is true.
- Learn the statistical methods used to determine relationships between weather variables and disease incidence.
- Understand the concept and application of correlation in epidemiological studies.
- Distinguish between different statistical terms and their significance in research findings.

Learning Objectives
- Learn the statistical methods used to determine relationships between weather variables and disease incidence.
- Understand the concept and application of correlation in epidemiological studies.
- Distinguish between different statistical terms and their significance in research findings.
Related questions
Paulo Tells You That He Just Completed an Experiment in ...
There Is an Important Difference Between a Significant Result and ...
Which of the Following Correlation Coefficients Indicates the Strongest Relationship ...
If the Difference in a Measured Behavior Is So Small ...
________ Means That the Observed Differences Between Scores Is Probably ...