Asked by Priscilla Trujillo on Jul 13, 2024

Verified
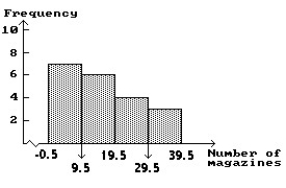
In a survey,20 people were asked how many magazines they had purchased during the previous year.The results are shown below.Construct a histogram to represent the data.Use 4 bins with a bin width of 10,and begin with a lower bin limit of -0.5.What is the approximate amount at the centre?
6 15 3 36 25 18 12 18 5 30
24 7 0 22 33 24 19 4 12 9 
Bin Width
The size of intervals in a histogram or frequency distribution, affecting data visualization and analysis.
Lower Bin Limit
The smallest value in a range (bin) for grouping data points in a histogram or frequency distribution chart.
Histogram
A graphical display of data using bars of different heights to represent the frequency of numerical data intervals.
- Understand the construction and interpretation of histograms.

Verified Answer
BN

Learning Objectives
- Understand the construction and interpretation of histograms.