Asked by Claudia Gonzalez on Apr 26, 2024

Verified
Graph the function f(x) =−log2(x−1) f ( x ) = - \log _ { 2 } ( x - 1 ) f(x) =−log2(x−1) .
A) 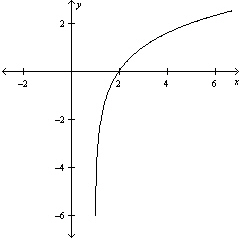
B) 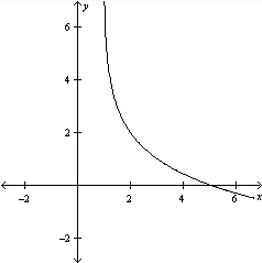
C) 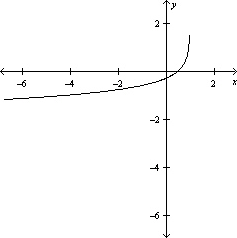
D) 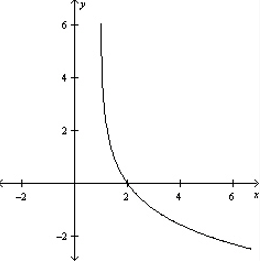
E) 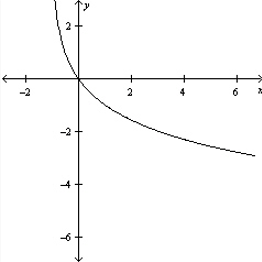
Function
A relation between sets that associates each element of a first set to exactly one element of the second set.
Graph
A visual representation of data, equations, or relationships between variables.
Logarithm
The exponent to which a base, often 10 or e, needs to be elevated to yield a specific number.
- Interpret and graph logarithmic functions.

Verified Answer
AN
Andrew NorcrossApr 26, 2024
Final Answer :
D
Explanation :
The domain of the function is all real numbers greater than 1, as the argument of the logarithm must be positive. The function is decreasing and asymptotic to the x-axis as x approaches 1 from above. The graph also has a vertical asymptote at x=1. Therefore, option D is the correct graph.

Learning Objectives
- Interpret and graph logarithmic functions.