Asked by Angel Martinez on May 20, 2024

Verified
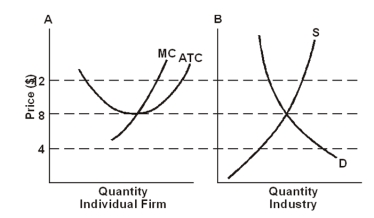
Given the industry supply and demand shown on the right side of the below graph,use the left side of the figure to draw the perfect competitor's demand,marginal revenue,average total cost,and marginal cost curves for its long-run situation.
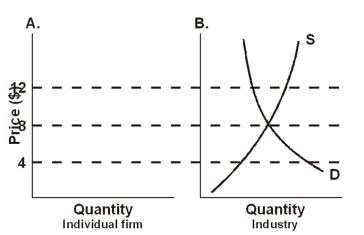
Industry Supply
The total quantity of a specific good or service that all firms in an industry are willing to sell at a given price level.
Demand
The quantity of a good or service that consumers are willing and able to purchase at various prices during a specified time period.
Marginal Revenue
The additional revenue that a firm generates from selling one more unit of a good or service.
- Recognize and categorize long-term and short-term supply curves.
- Understand the concept of efficiency in output production.

Verified Answer
JO

Learning Objectives
- Recognize and categorize long-term and short-term supply curves.
- Understand the concept of efficiency in output production.