Asked by Madison Brown on Jul 08, 2024

Verified
{Business School Graduates Narrative} Draw a pie chart of this data.Are you able to reconstruct the original data from this pie chart alone?
Frequency Distribution
A summary of how often each value occurs in a dataset by grouping values into intervals or categories.
Business School Graduates
Individuals who have successfully completed their studies at a business school, often obtaining degrees such as MBA.
- Develop and understand the construction of frequency distribution tables, pie charts, and bar graphs.

Verified Answer
VH
Vivica HodgesJul 09, 2024
Final Answer : 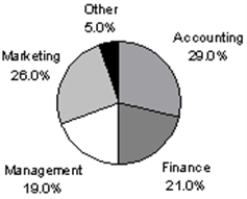 No; you cannot reconstruct the original data from this pie chart alone,because you don't know how many observations are in each category.
No; you cannot reconstruct the original data from this pie chart alone,because you don't know how many observations are in each category.
Learning Objectives
- Develop and understand the construction of frequency distribution tables, pie charts, and bar graphs.