Asked by Aaron Guerra on Jun 10, 2024

Verified
{Ages of Jockeys Narrative}
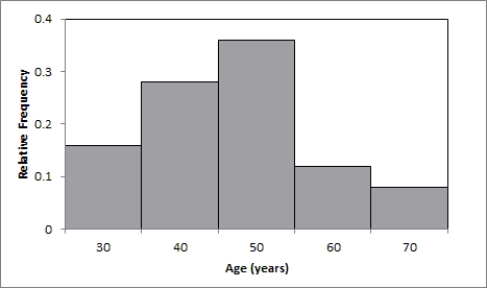
a.Construct a relative frequency histogram for the data.
b.What does the histogram tell you about the distribution of the data?
Relative Frequency Histogram
A type of histogram that displays the relative frequencies of different classes of data, showing the proportion of data that falls into each class.
Ages of Jockeys
This term could refer to a statistical analysis or data collection of the ages of individuals who professionally ride horses in races.
Distribution
In statistics, the way in which values of a variable or dataset are spread out or distributed across possible values.
- Generate and decipher graphical displays of data, like box plots, histograms, and frequency distributions.
- Understand the concept of relative frequency and its application in constructing distributions.

Verified Answer

Learning Objectives
- Generate and decipher graphical displays of data, like box plots, histograms, and frequency distributions.
- Understand the concept of relative frequency and its application in constructing distributions.
Related questions
The Bar Graph Below Represents the Highest Education Level Achieved ...
The Bar Graph Below Represents the Highest Education Level Achieved ...
The Bar Graph Below Represents the Highest Education Level Achieved ...
The Bar Graph Below Represents the Highest Education Level Achieved ...
What Is a Frequency Distribution
