Asked by shelby hulka on May 19, 2024

Verified
(Advanced analysis) The equation for the demand curve in the below diagram: 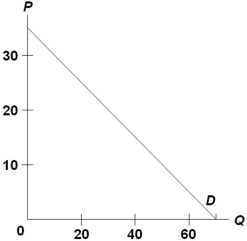
A) is P = 70 - Q.
B) is P = 35 - 2Q.
C) is P = 35 - .5Q.
D) cannot be determined from the information given.
Demand Curve
A graphical representation showing the relationship between the price of a good and the quantity demanded by consumers at various prices.
Equation
A mathematical statement that asserts the equality of two expressions, typically involving variables and constants.
Advanced Analysis
The application of sophisticated techniques and tools to examine complex datasets in order to derive meaningful insights and conclusions.
- Familiarize with the graphical representation of demand and supply curves and market equilibrium.

Verified Answer
NC
Neisy CullerMay 22, 2024
Final Answer :
C
Explanation :
The demand curve in the diagram has a y-intercept of 35 and a slope of -0.5, indicating that for every one-unit increase in quantity demanded (Q), the price (P) decreases by 0.5 units. Therefore, the equation for the demand curve is P = 35 - 0.5Q, which corresponds to choice C.

Learning Objectives
- Familiarize with the graphical representation of demand and supply curves and market equilibrium.