Asked by Jaysha sereal on Jul 29, 2024

Verified
A survey was conducted in 20 counties to determine the percentage of teenagers who had used marijuana and other drugs.Data shown on the following scatterplot indicate a correlation of 0.972 between the percent of teens who have used marijuana and the percent who have used other drugs.Describe the association. 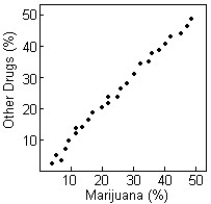
A) Strong curved relation in a positive direction
B) Weak linear relation in a positive direction
C) Strong linear relation in a positive direction
D) Strong nonlinear relation in a positive direction
E) No evidence of relation
Scatterplot
A scatterplot is a type of graph used in statistics to display values for typically two variables for a set of data, showing the relationship between them.
Correlation
A statistical measure that represents the extent to which two or more variables fluctuate together, indicating the strength and direction of their relationship.
Marijuana
A substance from the Cannabis plant with mind-altering effects, utilized for either therapeutic or leisure activities.
- Detect distinct categories of links, for instance, linear and exponential, between variables represented in scatterplots.
- Conceive the importance of correlation in gauging the strength and direction of associations between variables.

Verified Answer

Learning Objectives
- Detect distinct categories of links, for instance, linear and exponential, between variables represented in scatterplots.
- Conceive the importance of correlation in gauging the strength and direction of associations between variables.
Related questions
A Shop Owner Tries to Predict Heater Sales by Displaying ...
A Reporter Investigates Speeding on Roads in a County and ...
Adam Would Like to Buy a Used Car,and Collected Several ...
Which of the Following Represents the Weakest Correlation Between Two ...
Correlational Research Is Most Useful for Purposes of ...