Asked by Blake Archer on May 01, 2024

Verified
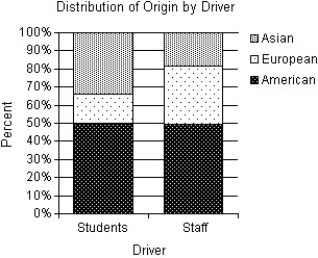
A survey of automobiles parked in student and staff lots at a large university classified the brands by country of origin.The results are listed in the table below. driverorigin Student Staff North American 10179 European 3351 Asian 6829\begin{array}{|l|cc|}&driver\\\hline origin& \text { Student } & \text { Staff } \\\hline \text { North American } & 101 & 79 \\\text { European } & 33 & 51 \\\text { Asian } & 68 & 29 \\\hline\end{array}origin North American European Asian driver Student 1013368 Staff 795129 Create a segmented bar graph which shows the conditional distributions of origin for both students and staff.
Country of Origin
Country of origin denotes the country where a product was manufactured, produced, or grown, often influencing consumer perceptions and trade regulations.
Segmented Bar Graph
A segmented bar graph is a visual chart that divides bars into segments to compare parts of a whole across different categories.
Conditional Distributions
Conditional distributions are the distributions of a subset of variables within a statistical study, given that certain conditions related to other variables are satisfied.
- Comprehend the formation and analysis of segmented bar charts for data in categories.
- Assess relationships between two categorical variables through the use of graphical and tabular data displays.

Verified Answer

Learning Objectives
- Comprehend the formation and analysis of segmented bar charts for data in categories.
- Assess relationships between two categorical variables through the use of graphical and tabular data displays.
Related questions
When Displaying the Distribution of Quantitative Data,it Is Best to ...
A Display Used to Compare the Frequency, Relative Frequency or ...
The Chi-Square Test Can Compare More Than Two Populations
Because Statistical Software Plays Such an Important Role in Modern ...
Because Statistical Software Plays Such an Important Role in Modern ...