Asked by Daniela Lopez on Jun 19, 2024

Verified
A supermarket's monthly sales (in thousands of dollars)for the last year were as follows:  Construct a relative frequency bar chart for this data set.How many observations are there in this data set?
Supermarket's Sales
The total revenue generated from the sale of goods and services at a supermarket.
Relative Frequency Bar Chart
A type of bar chart that displays the relative frequency of various categories of a dataset, showing how each category compares in proportion to the total.
- Acknowledge and generate assorted forms of charts, namely frequency histograms and line charts, and realize their applications.
- Analyze and render survey data through the analysis tools of histograms and frequency distributions.

Verified Answer
ED
Ellery DawsonJun 20, 2024
Final Answer :
See the graph below.There are 12 observations in this data set; one sales amount is listed for each month. 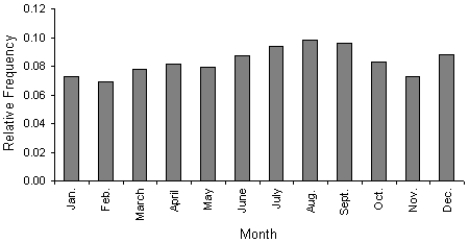

Learning Objectives
- Acknowledge and generate assorted forms of charts, namely frequency histograms and line charts, and realize their applications.
- Analyze and render survey data through the analysis tools of histograms and frequency distributions.