Asked by Shani Montes Victorio on Jul 12, 2024

Verified
A researcher is investigating variables that might be associated with the academic performance of high school students.She examined data from 1990 for each of the 50 states plus Washington,DC.The data included information on the following variables. 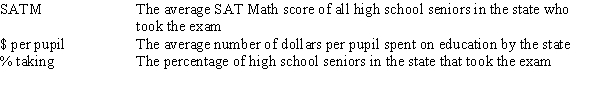 As part of her investigation,she ran the multiple regression model SATM = 0 + 1($ per pupil) + 2(% taking) + i,
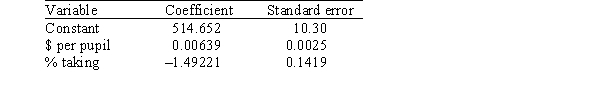
Where the deviations i were assumed to be independent and Normally distributed with a mean of 0 and a standard deviation of .This model was fit to the data using the method of least squares.The following results were obtained from statistical software. 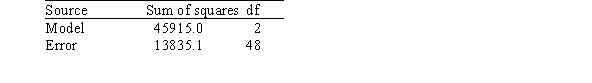
 What is the value of the MSE?
A) 10.30
B) 288.23
C) 13835.10
D) 22957.50
Multiple Regression
A method in statistics that employs multiple predictor variables to forecast the value of a dependent variable.
Academic Performance
A measure of student achievement across various academic subjects, typically based on grades, test scores, and other criteria.
SATM
Often refers to the mathematics section of the SAT, a standardized test widely used for college admissions in the United States.
- Understand the principles and application of multiple linear regression in research.
- Identify the components of a regression analysis output, including coefficients, R-squared values, and F-statistics.

Verified Answer

Learning Objectives
- Understand the principles and application of multiple linear regression in research.
- Identify the components of a regression analysis output, including coefficients, R-squared values, and F-statistics.
Related questions
Data Were Obtained in a Study of the Oxygen Uptake ...
In This Experiment,the Risk-Taking Propensity of 90 Inner City Drug ...
In Multiple Regression,what Does the Parameter 2 Measure ...
A Multiple Linear Regression Model Can Be Described by DATA ...
The Relationship Between the Cost of a Taxi Ride (Y)and \(\hat{\text ...