Asked by Kaitlin Ptacek on Jun 07, 2024

Verified
A professor of economics wants to study the relationship between income (y in $1000s) and education (x in years). A random sample eight individuals is taken and the results are shown below. 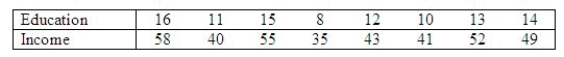 Determine the standard error of estimate.
sr = ______________
Describe what this statistic tells you about the regression line.
____________________________
Determine the coefficient of determination.
R2 = ______________
Discuss what its value tells you about the two variables.
________________________________________________________
Calculate the Pearson correlation coefficient.
r = ______________
Why does it have the sign it has?
________________________________________________________
Conduct a test of the population slope to determine at the 5% significance level whether a linear relationship exists between years of education and income.
Test statistic:
t = ______________
Rejection Region:
Reject H0 if | t | > ______________
Conclusion:
______________
A linear relationship ______________ between years of education and income.
Standard Error Of Estimate
A measure of the accuracy of predictions made with a regression line, specifically, it estimates the standard deviation of the error term.
Coefficient Of Determination
A measure used in statistical analysis to assess the goodness of fit of a model, represented as the proportion of variance in the dependent variable that is predictable from the independent variable(s).
Pearson Correlation Coefficient
A measure of the linear correlation between two variables X and Y, giving a value between -1 and 1 which indicates the strength and direction of the correlation.
- Ascertain and expound upon the standard error of estimate together with the standard error of the slope.
- Master the concepts and calculation methods for the coefficient of determination.
- Calculate and interpret the coefficient of correlation.

Verified Answer

Learning Objectives
- Ascertain and expound upon the standard error of estimate together with the standard error of the slope.
- Master the concepts and calculation methods for the coefficient of determination.
- Calculate and interpret the coefficient of correlation.
Related questions
Given That the Sum of Squares for Error Is 60 ...
The Coefficient of Determination Measures the Amount Of ...
One Way to Measure the Strength of the Relationship Between ...
A Regression and Correlation Analysis Resulted in the Following Information ...
The Following Information Regarding a Dependent Variable (Y) and an ...