Asked by Renee Sinclair on Jul 29, 2024

Verified
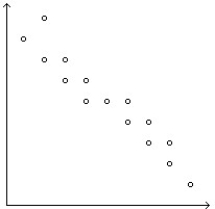
A) Linear association,moderately strong association
B) Linear association,very strong association
C) Negative association,linear association,very strong association
D) Negative association,moderately strong association
E) Negative association,linear association
Very Strong Association
A term used in statistics to describe a relationship between two variables that shows a high level of correlation or dependency.
Linear Association
A relationship between two variables that can be graphically represented with a straight line, indicating that changes in one variable correlate to changes in the other.
Negative Association
A connection between two variables where as one variable rises, the other falls.
- Apply understanding of scatterplots to elucidate the correlations between quantitative variables.
- Differentiate between associative properties such as positive, negative, and no association.

Verified Answer

Learning Objectives
- Apply understanding of scatterplots to elucidate the correlations between quantitative variables.
- Differentiate between associative properties such as positive, negative, and no association.
Related questions
The Scatterplot Is a Graph That Is Used to Graphically ...
If the Linear Relationship Between the Dependent and Independent Variables ...
A Scatterplot Is Not Particularly Useful in Determining If the ...
In Constructing a Scatterplot, It Would Not Be Appropriate To ...
The Owner of a Small Manufacturing Plant Employs Nine People ...