Asked by Xavier Ortiz Jr on Mar 10, 2024

Verified
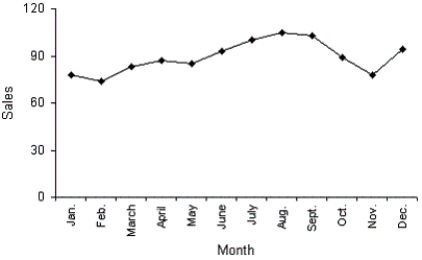
A department store's monthly sales (in thousands of dollars)for the last year were as follows.A histogram should be used to present these data. 
Histogram
A graphical representation of data using bars to show the frequency of numerical data intervals, emphasizing the distribution of data.
- Recognize the appropriate graphical representation for various types of data.

Verified Answer
MP

Learning Objectives
- Recognize the appropriate graphical representation for various types of data.
Related questions
A Relative Frequency Histogram Can Be Constructed for Qualitative as ...
A Pie Chart Is a Portrayal of Divisions of Some ...
Time Series Data Are Often Graphically Depicted on a Line ...
Scatterplots Can Be Used to Explain the Relationship Between One ...
Thomas Is Preparing a Report on the Cost of Living ...